.webp)
TL;DR
- Marketing measurement tools appear to contradict each other because they are designed for different time horizons, not because one of them is wrong.
- Marketing mix modelling (MMM) runs quarterly to guide your strategic budget allocation.
- Incrementality testing runs monthly to validate performance and generate calibration multipliers.
- Attribution runs weekly to manage day-to-day execution, adjusted by those multipliers.
- Unifying these methods into a three-layer framework ensures your team makes decisions based on clarity, not contradictory data
If you've ever sat in a room where your ad platform dashboard, your attribution tool, and your MMM report are all showing different numbers, then you'll know the particular exhaustion that comes with it. Not just the confusion, but the way it erodes confidence. Which number do you present to the board? Which channel do you cut? Who's right?
The honest answer is: probably all of them, in different ways. And that's actually the starting point for building a measurement setup that works.
This isn't about finding one tool to rule them all, but rather about understanding what each method is designed to measure, when to use it, and (most importantly) how to connect them so they inform each other rather than contradict each other. It's the framework we keep coming back to with clients who want to move from measurement overwhelm to genuine decision clarity.
Why marketing measurement requires more than a single source of truth
At first glance, what's not to like? It is, after all, a very seductive idea: one dashboard, one number, one answer. And we understand why it's appealing, especially when you're under pressure to justify spend or make a fast budget call.
But!! (There's always a but) Attribution is an estimate, not a fact. Every measurement method (last-click, data-driven, MMM, incrementality) is a model built on assumptions. Different assumptions, different outputs. That's not a flaw in your stack; it's just how measurement works.
The more useful question isn't "which tool is correct?" It's "which tool was designed to answer the question I'm actually asking right now?"
That reframe is the foundation of our internal measurement: a 3-layer framework that maps each measurement method to a specific time horizon, decision type, and level of budget authority. When each tool is doing the job it was built for, the apparent contradictions between them largely dissolve because they're no longer competing to answer the same question.
Our measurement framework: 3 layers for 3 jobs
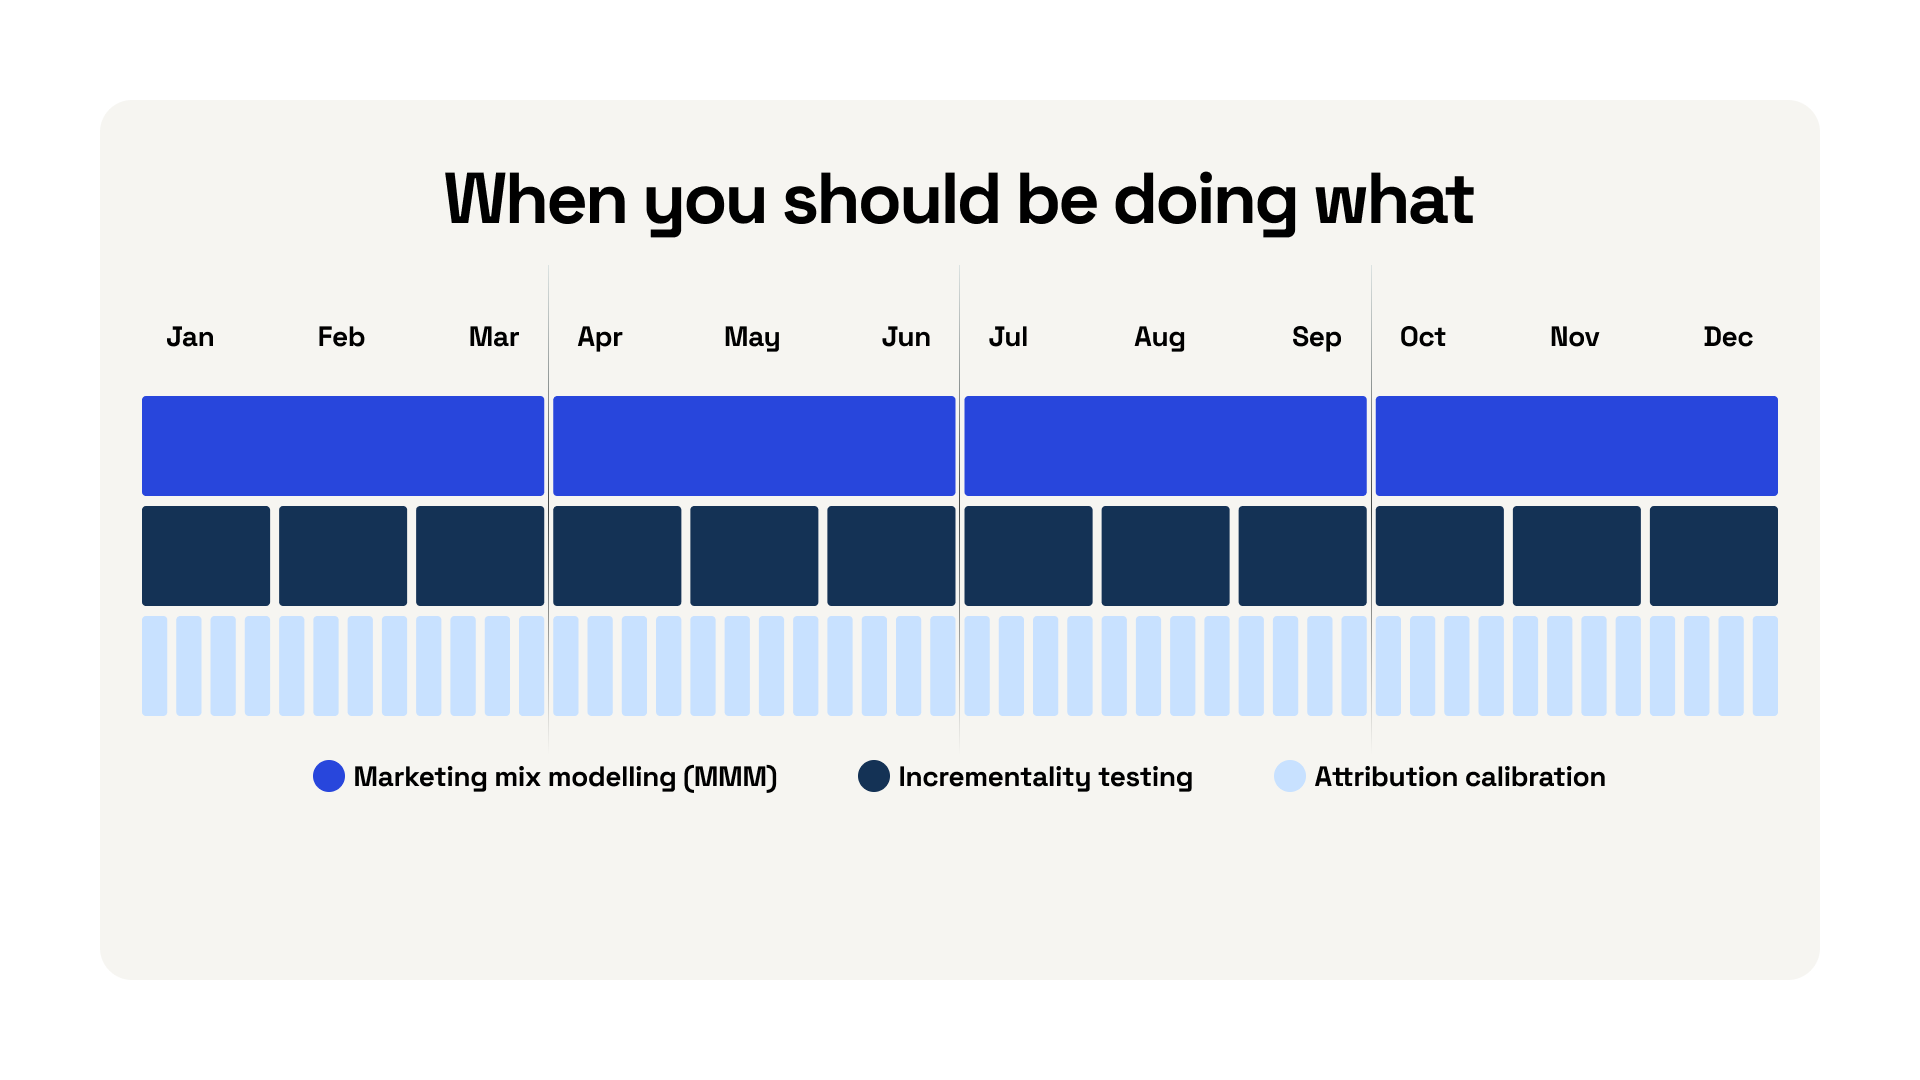
This framework organises marketing measurement into 3 distinct layers (measurement methods): a quarterly strategic layer (MMM), a monthly learning layer (incrementality testing), and a weekly execution layer (calibrated attribution). Each layer feeds into the next and is mapped to a specific decision type. The framework holds that no single measurement method can serve all 3 horizons simultaneously, and that calibration between layer (rather than consolidation into a single source of truth) is the correct goal of a modern measurement stack. In short, all three layers are needed for the framework to hold together.
Layer 1. The strategic view: Quarterly (MMM)
.webp)
What is Marketing Mix Modelling (MMM)?
Marketing Mix Modelling (MMM) is a statistical method that measures the incremental contribution of each marketing channel to business outcomes, whilst controlling for external factors including macroeconomics, seasonality, and competitor activity. It is designed for quarterly strategic decisions and is the only common measurement method that accounts for factors outside the ad account.
Marketing Mix Modelling (MMM) is genuinely one of the more elegant tools in the measurement toolkit... and also one of the most misused. It's often either ignored entirely or, just as problematically, asked to do things it wasn't designed for, like informing weekly bid decisions.
MMM's job is to give you the long view. Once a quarter, it produces a statistically grounded read of each channel's incremental contribution to your business, while accounting for everything happening outside your ad accounts: macroeconomics, competitor pricing, seasonality, organic demand shifts. It's the only measurement method that genuinely tries to model the world, not just your ad data.
What MMM does well
Setting high-level budget allocations across channels. Validating whether your overall investment direction makes sense. Giving you something credible to present to a board that doesn't trust platform metrics (and honestly, they're right to be sceptical).
What MMM isn't for
Granular, week-by-week optimisation. Its value is in the strategic signal, not the tactical detail.
A proper MMM study typically takes 4 to 6 weeks to set up. It ingests historical spend, sales data, macroeconomic indicators, and competitor signals. Productised solutions have made this considerably more accessible; costs typically range from €1,500 to €4,500 per month depending on the complexity of your data, compared to significantly higher costs for fully bespoke manual studies.
What we recommend at Precis:
Marketing Mix Modelling should be run quarterly, not continuously. Its value is in the strategic signal — setting high-level budget allocations, validating overall investment direction, giving you something credible for the board. Using MMM outputs to inform daily bid decisions is a category error that produces worse outcomes than a well-calibrated weekly attribution model would. Save it for the question it was built for.
In short:
- What it is: A statistical analysis that accounts for factors outside of marketing, such as macroeconomics, competitor price shifts, and seasonality. It proves the incremental value of marketing that standard dashboards often miss.
- Setup time: Typically 4–6 weeks to ingest historical data, macro indicators, and competitor shifts
- Run time: Strategic outputs are refreshed once per quarter to set high-level budget allocations.
- Cost: While full-scale manual studies vary, productised solutions typically range from €1,500 to €4,500 per month depending on the complexity of the data integration.
- Why you need it: An MMM study is sweet music to your board’s ears: it proves the incremental value of marketing that dashboards often miss.
Layer 2. The learning engine: Monthly (incrementality testing)
.webp)
What is incrementality testing?
Incrementality testing is a controlled experiment that measures how much of a business outcome (sales, sign-ups, revenue) was genuinely caused by advertising, as opposed to what would have happened organically without it. The three main forms are GeoX studies, brand lift studies, and hold-out tests. In our framework, incrementality testing runs monthly and produces calibration multipliers that adjust weekly attribution models.
If MMM is your strategic map, incrementality testing is how you check whether the map still matches the territory. Running at least one incrementality study per month gives you the kind of ground-truth signal that keeps your weekly decisions properly calibrated... and stops your assumptions from quietly drifting out of date.
You don't need to overcomplicate it. Essentially, there are 3 types of incrementality tests: GeoX studies, Brand lift studies, and hold-out tests.
GeoX studies

You divide geographic regions (think Stockholm vs Gothenburg, or Paris vs Lyon) into test and control groups. Spend is increased or adjusted in the test markets whilst control markets run as normal. The difference in sales lift between the two groups reveals the true incremental impact of the change.
One methodological wrinkle worth knowing about: GeoX studies can be affected by what researchers call SUTVA violation. Essentially, geographic spillover. If a customer in your control city regularly commutes through your test city and sees your ads there, your clean split is no longer clean. It's worth designing your geographic splits carefully, with enough distance and audience distinction between groups to minimise this. Open-source frameworks like Google's GeoX and Meta's GeoLift can meaningfully reduce tooling costs, but do factor in the opportunity cost of deliberately under-optimising spend in control regions. That's a real consideration, especially in commercially important markets.
Brand lift studies

These are survey-based experiments run directly inside platforms like YouTube, Meta, and TikTok. The platform identifies two statistically comparable audiences (one exposed to your ad, one not) and surveys both with a single question, such as "Which of these brands have you heard of?" The difference in response rates is your brand awareness lift.
Platforms typically don't charge for the study itself, but they do require a minimum spend threshold (often between €10,000 and €50,000 over a 30-day period) to reach statistical significance. So these work best for campaigns that are already operating at that scale.
Hold-out tests
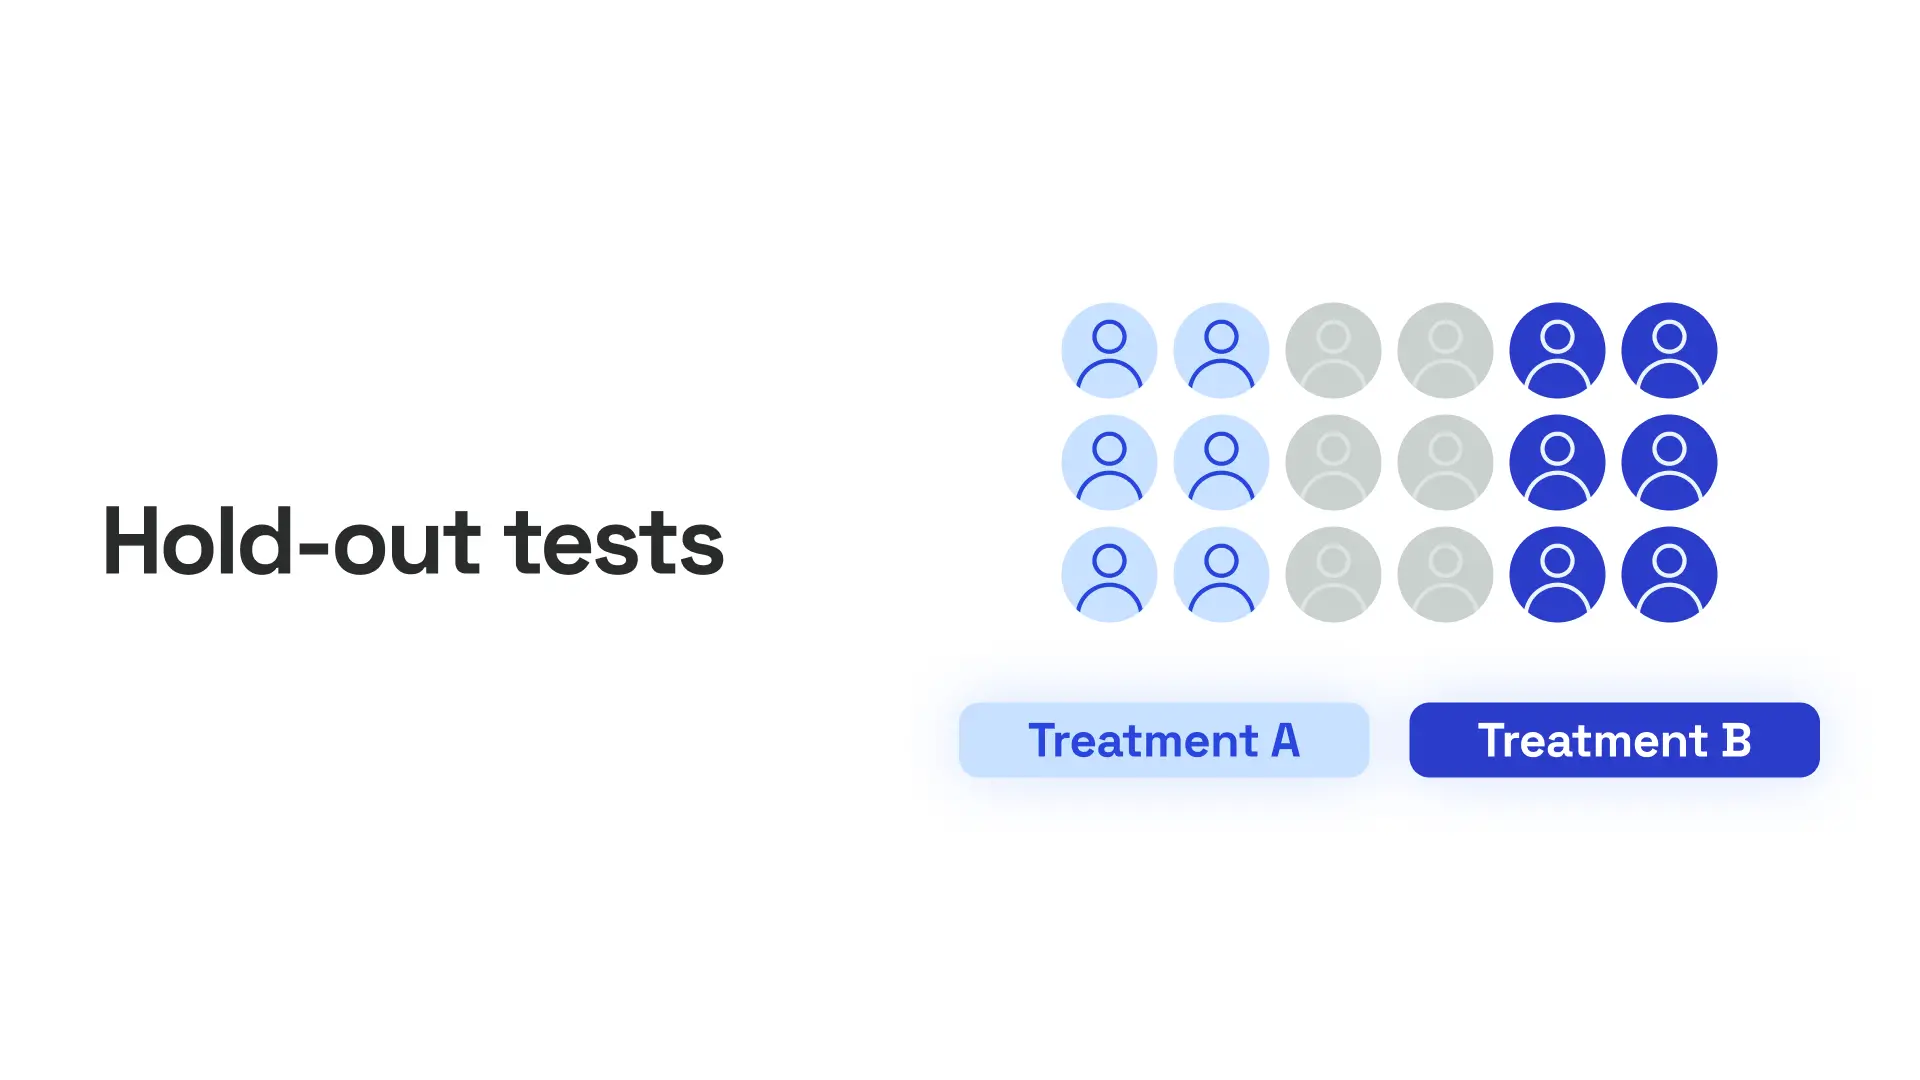
The most "brutal" form of incrementality measurement. A defined percentage of your total addressable audience is completely withheld from advertising across all channels, then their conversion rate is compared with the exposed group. The gap between those two numbers is your genuine ad-driven revenue. Everything else would have converted organically anyway.
Many retailers schedule hold-out tests during quieter trading periods to reduce the commercial risk of withholding ads from a portion of their audience. That's a sensible approach: the goal is clean data, and a quieter month is a perfectly good time to collect it.
What we recommend at Precis
Commit to a monthly incrementality testing cadence — at least one study per month, with a clearly defined output: a calibration multiplier that adjusts your weekly attribution model. A test that doesn't connect to a downstream decision is a research exercise, not a measurement investment. Without that link between layers, your stack is generating interesting reports rather than better decisions
Layer 3. The steering wheel: Weekly (attribution and calibration)
.webp)
What is calibrated attribution?
Calibrated attribution is a weekly measurement approach in which a multi-touch attribution model's channel-level outputs are adjusted by multipliers derived from quarterly MMM studies and monthly incrementality tests. Unlike raw platform attribution, which reflects only what a single platform can observe, calibrated attribution corrects for known systematic biases and produces budget recommendations that account for the full picture of marketing effectiveness.
This is where the day-to-day budget calls happen. But there's a meaningful distinction between a team that optimises against raw platform attribution numbers and one that optimises against calibrated attribution numbers. And it's worth understanding why that distinction matters so much.
Here's how calibration works in practice. Your quarterly MMM study produces channel-level multipliers: correction factors that reflect the gap between what your attribution tool reports and what's actually happening in the market. Your monthly incrementality tests refine and pressure-test those multipliers. Your weekly attribution model then applies them so the recommendations you're optimising against reflect reality, not just platform reporting.
A concrete example: Suppose your MMM indicates that paid social is generating around 40% more incremental revenue than your attribution tool reports. You apply a 1.4x multiplier to paid social in your weekly optimisation model. Now, when your attribution tool shows paid social apparently underperforming, your calibrated model correctly reads that as a potential buy signal — not a cut signal. That's a genuinely different decision, made possible only because the layers are connected.
It's also worth optimising toward gross profit (GP3) rather than revenue or ROAS at this layer. Platform-reported ROAS is a ratio of ad spend to attributed revenue: it says nothing about whether that revenue was profitable, incremental, or would have happened anyway. GP3 brings you closer to the number that actually matters to the business.
What we recommend at Precis:
Calibrated, platform-independent attribution will consistently produce different channel recommendations than platform-native reporting—and in our experience, more accurate ones. Platform-native attribution has a structural conflict of interest: it's built to attribute credit to the platform it belongs to. Tools like Alvie are designed to remove that bias. It tells you how each of your channels or markets are performing, and most importantly: what to do about it here and now from a budget allocation perspective. And it allows for you to connect it to the rest of your measurement stack.
In short:
- What weekly attribution and calibration are: Daily or weekly analysis to reallocate budgets based on a unified attribution model that has been calibrated with strategic insights.
- Setup time: Immediate to 1 week once data sources (Shopify, Meta, Google Ads) are connected.
- Run time: Daily/Weekly—The model provides near real-time recommendations to move spend toward profit (GP3) rather than just revenue (ROAS).
- Our recommendation is always to choose an unbiased platform like Alvie. We don’t advise to rely on last-click attribution.
3 questions to diagnose your current setup
Before adding anything new to your measurement setup, it's worth running this quick diagnostic on what you have:
The horizon audit
Map each measurement tool you use to one of the three layers: quarterly strategy (MMM), monthly learning (incrementality), or weekly execution (attribution). If a tool is being used outside its designed time horizon (say, MMM outputs being used to make daily bid decisions, or GA4 being used to set annual budget allocations) that's the first thing to address. No amount of new tooling fixes a mismatch in how existing tools are being applied.
The calibration question
Ask your team: "What multiplier are we currently applying to our weekly attribution data, based on our last incrementality test?" If the answer is "none" or "we haven't run one recently", your measurement layers aren't talking to each other. Your data is producing reports rather than decisions — and that's a process problem, not a tooling problem.
The test cadence check
When did you last run a controlled incrementality test? If it was more than three months ago, your calibration data is stale. A good place to start is a single geographic hold-out test during a quieter trading month. Keep it simple. The goal isn't a perfect study,it's a proof of concept that gives you one calibrated multiplier to apply to your next €50,000 of budget decisions.
The goal isn't perfect measurement. It's calibrated confidence.
This framework won't eliminate uncertainty, because no framework does. But it does something genuinely useful: it structures uncertainty so that each tool is answering the question it was built for, each layer is informing the next, and your team has an agreed-upon cadence for making decisions rather than going in circles on the same data arguments every quarter.
The teams we see getting the most value from their measurement setups aren't the ones with the most tools (because that's so inefficient at the end of the day). Instead, they've taken the time to connect what they have and built a shared language for turning measurement into decisions. You can decide if you need more tools after that!
If you're working through any of this and want to think it through with someone, we're always up for a conversation about measurement. It's one of our favourite topics!
Marketing measurement FAQs
Some questions we get asked… a lot.
Why do MMM and attribution tools always show different numbers?
They will — and that's completely expected. MMM and attribution models are built on different assumptions and designed to answer different questions. MMM measures long-run, population-level effects. Attribution allocates credit at the individual conversion level. They're not competing answers to the same question; they're answers to different questions. We use our framework to treat them that way, so the disagreement becomes structural information rather than a source of confusion.
How much historical data do you need to run an MMM study?
You typically need at least 18 to 24 months of weekly sales and spend data across channels to produce a reliable MMM. If you're not there yet, that's fine! Focus on prioritising incrementality testing and calibrated attribution whilst you build the data foundation. A smaller, well-calibrated measurement consistently outperforms a larger uncalibrated one. You can introduce MMM when the data is ready.
What does it mean if your incrementality tests always show positive results?
It's worth being a little sceptical of uniformly positive results. Common culprits include under-designed holdout groups, tests that don't run long enough to reach significance, or geographic spillover in GeoX studies. A well-designed test should occasionally surface a channel that isn't delivering the lift you expected — and that's actually a good outcome. It means your measurement is catching something real. The goal of testing isn't to confirm your priors; it's to update them.
Why isn't GA4 sufficient as a standalone measurement tool?
GA4 is a genuinely useful tool, particularly for understanding on-site behaviour and user journeys. But it's designed for weekly execution decisions, not quarterly strategic ones. It has no model for external factors like seasonality or competitor activity, no mechanism for measuring true incrementality, and its attribution logic is a black box tied to Google's ecosystem. Using GA4 to set annual budget allocations is a bit like navigating by a street-level map when you need a satellite view. Both are useful; they're just designed for different altitudes.
Glossary of measurement terms
Attribution
The process of assigning credit for a conversion or sale to one or more marketing touchpoints. Attribution models range from simple rules-based approaches (last-click, first-click) to statistical models (data-driven attribution). All attribution models are estimates, not facts.
Calibration multiplier
A correction factor applied to a channel's attributed performance figures, derived from MMM and incrementality testing. For example, a 1.4x multiplier on paid social means that for every £1 of revenue attributed to paid social, the calibrated model treats it as £1.40. Calibration multipliers bridge the gap between what attribution reports and what actually happened.
GP3 (Third-party gross profit)
A profitability metric that accounts for the true margin of a sale after costs. Optimising toward GP3 rather than ROAS or revenue ensures that marketing spend is driving profitable growth, not just attributed revenue.
Incrementality
The portion of a business outcome — sales, conversions, revenue — that was genuinely caused by advertising, and would not have occurred without it. Incrementality is distinct from attributed revenue, which may include organic conversions that would have happened anyway.
SUTVA (Stable Unit Treatment Value Assumption)
A statistical assumption underlying GeoX and hold-out tests, which requires that the behaviour of control-group individuals is not affected by the treatment applied to test-group individuals. Geographic spillover (where people in a control region are exposed to ads targeted at a test region) constitutes a SUTVA violation and can bias incrementality results.
Authors

María Lorente
Senior Content Strategist
María Lorente
Senior Content Strategist